Total Deaths
The following graphs are made from data downloaded directly from the WA State DOH website. The downloadable data ended at the week of 7/19.
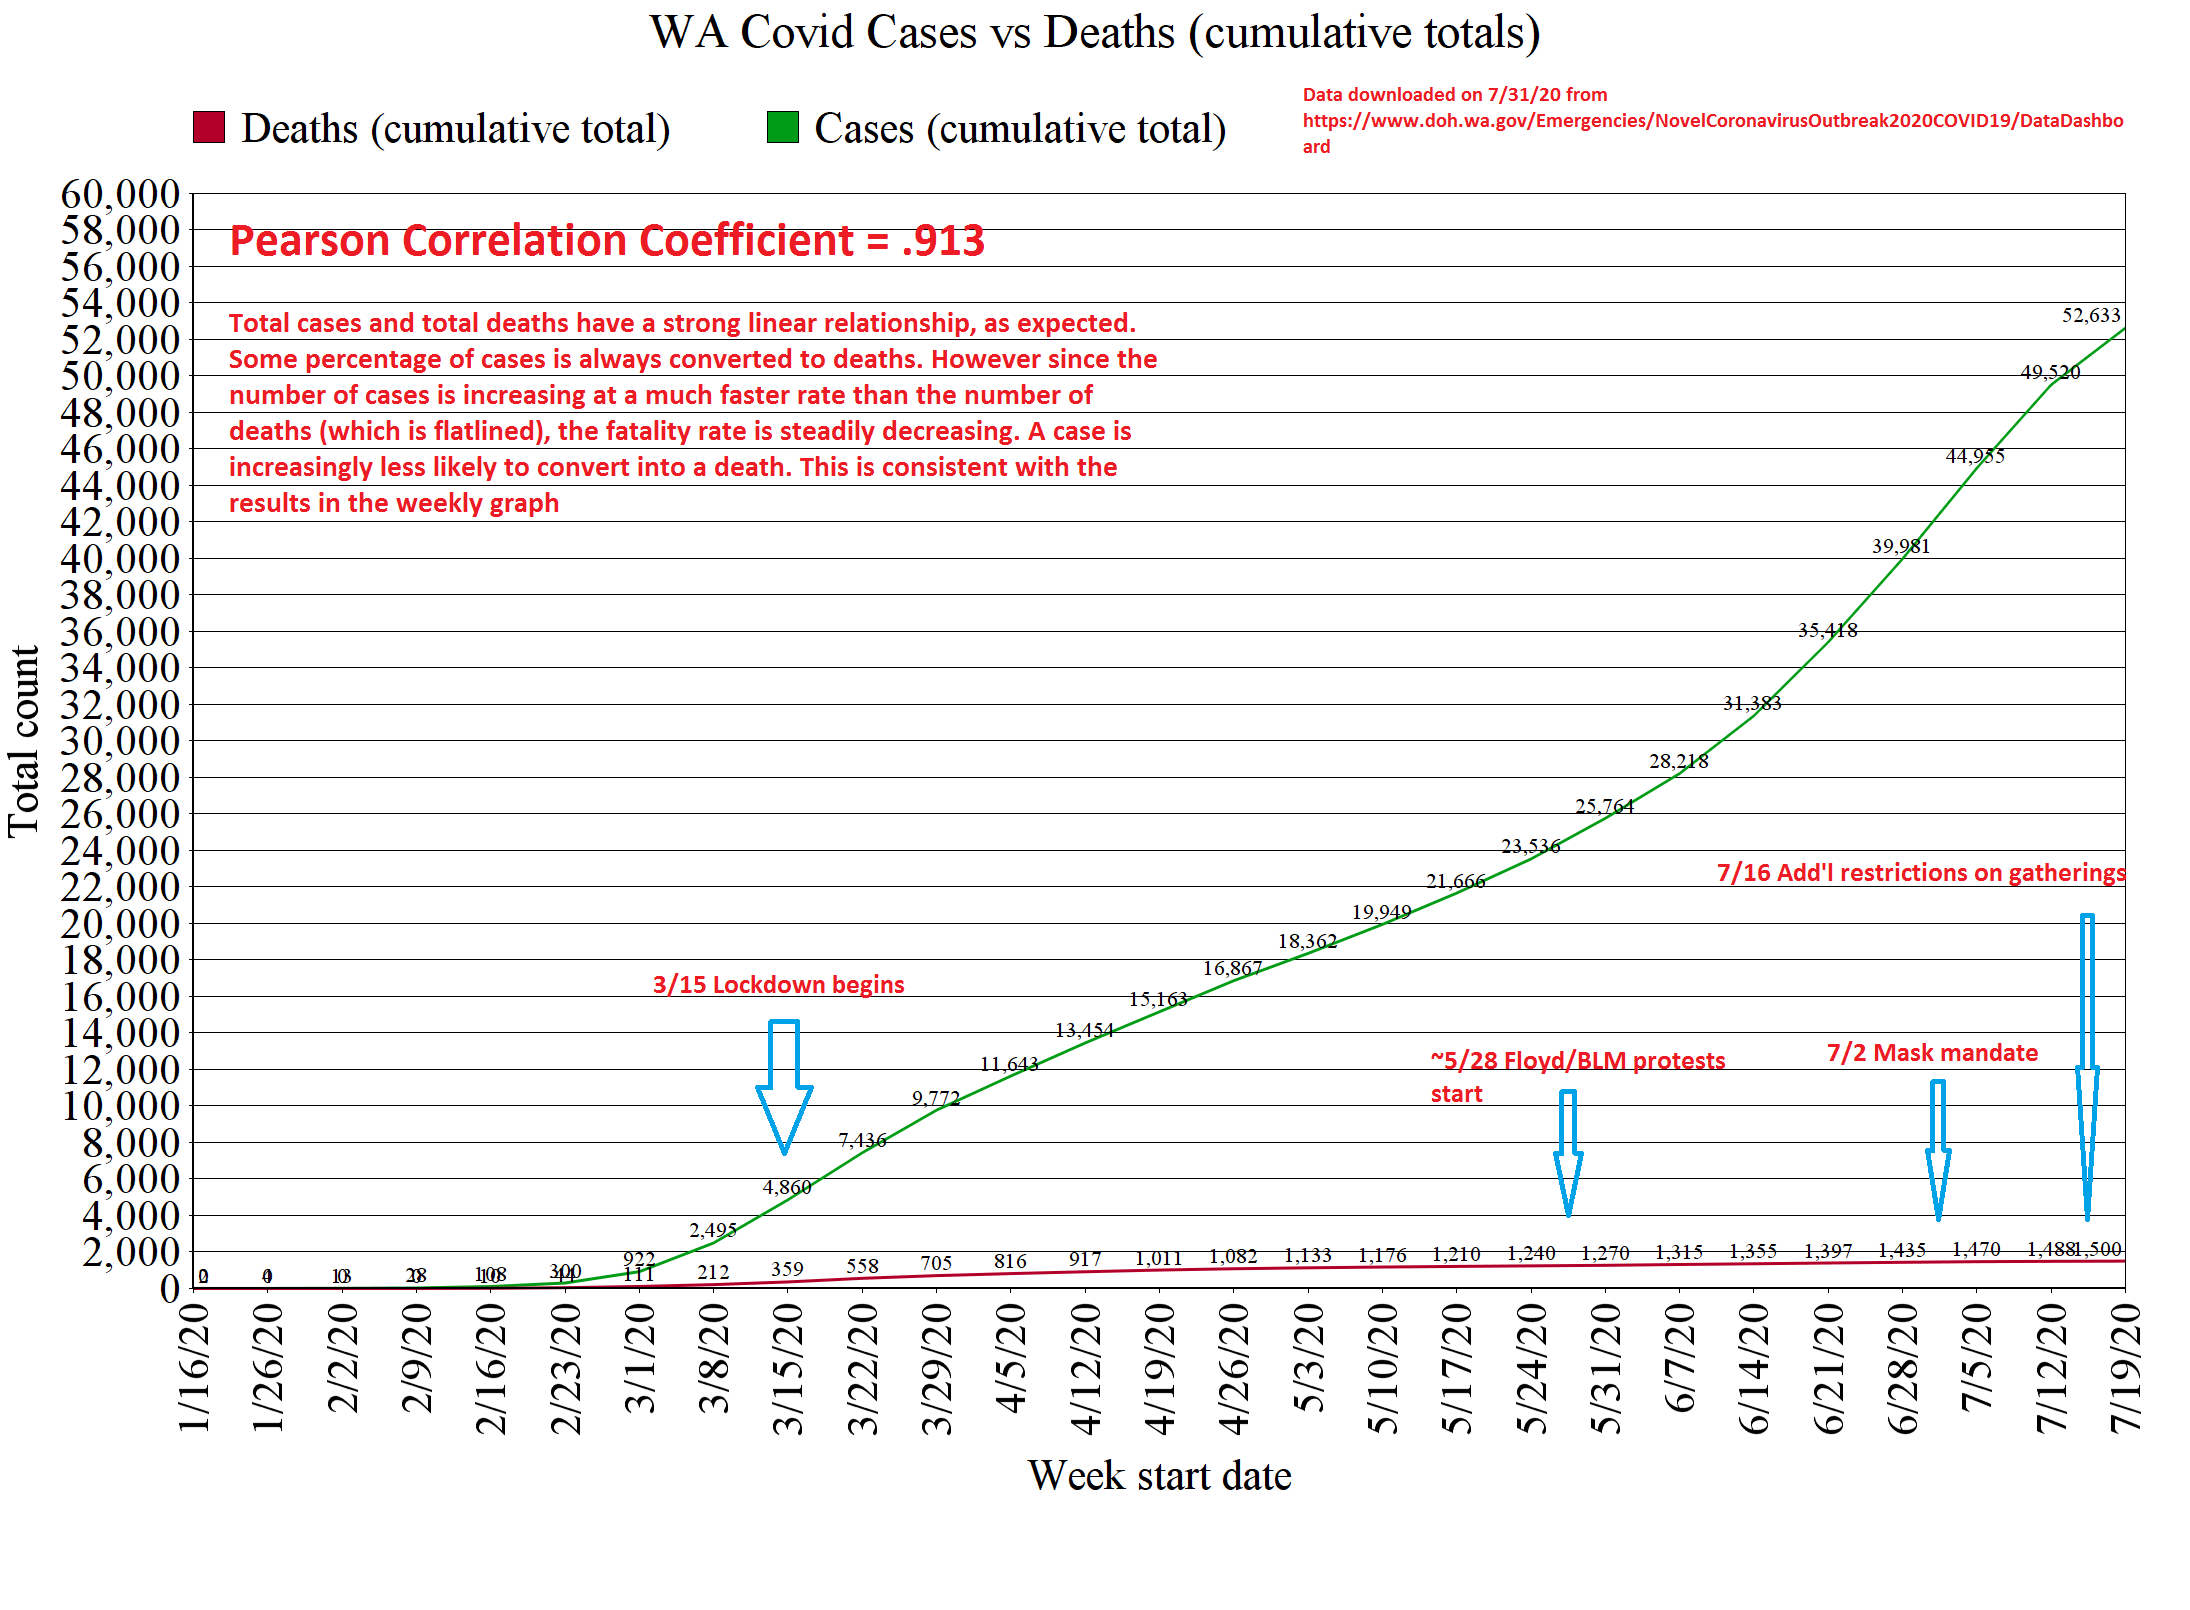
The death line is steadily flatlining as the cases line shoots upward. People are testing positive but are not getting seriously ill. This is why using total cases as your metric is pants-on-head retarded. It completely obscures the severity of the cases. Most of the people who test positive never even knew they had the virus. Furthermore, the more that cases go up while deaths continue to go down, the lower the case fatality rate becomes. It’s been steadily falling for months and as of the week of 7/19 is a tiny 0.38%, far, far lower than what was reported all spring and summer.
Since the REAL total infected number is much higher than the case number (not every exposed person has been tested), the true fatality rate is actually far lower than 0.38%. It may even be 0.038%, because on June 25 the director of the CDC reported:
That’s right, we continue to derail our economy over a virus that may only have a 0.038% fatality rate. What about the claims that the increases in positive cases will also lead to increases in deaths?
Weekly Deaths
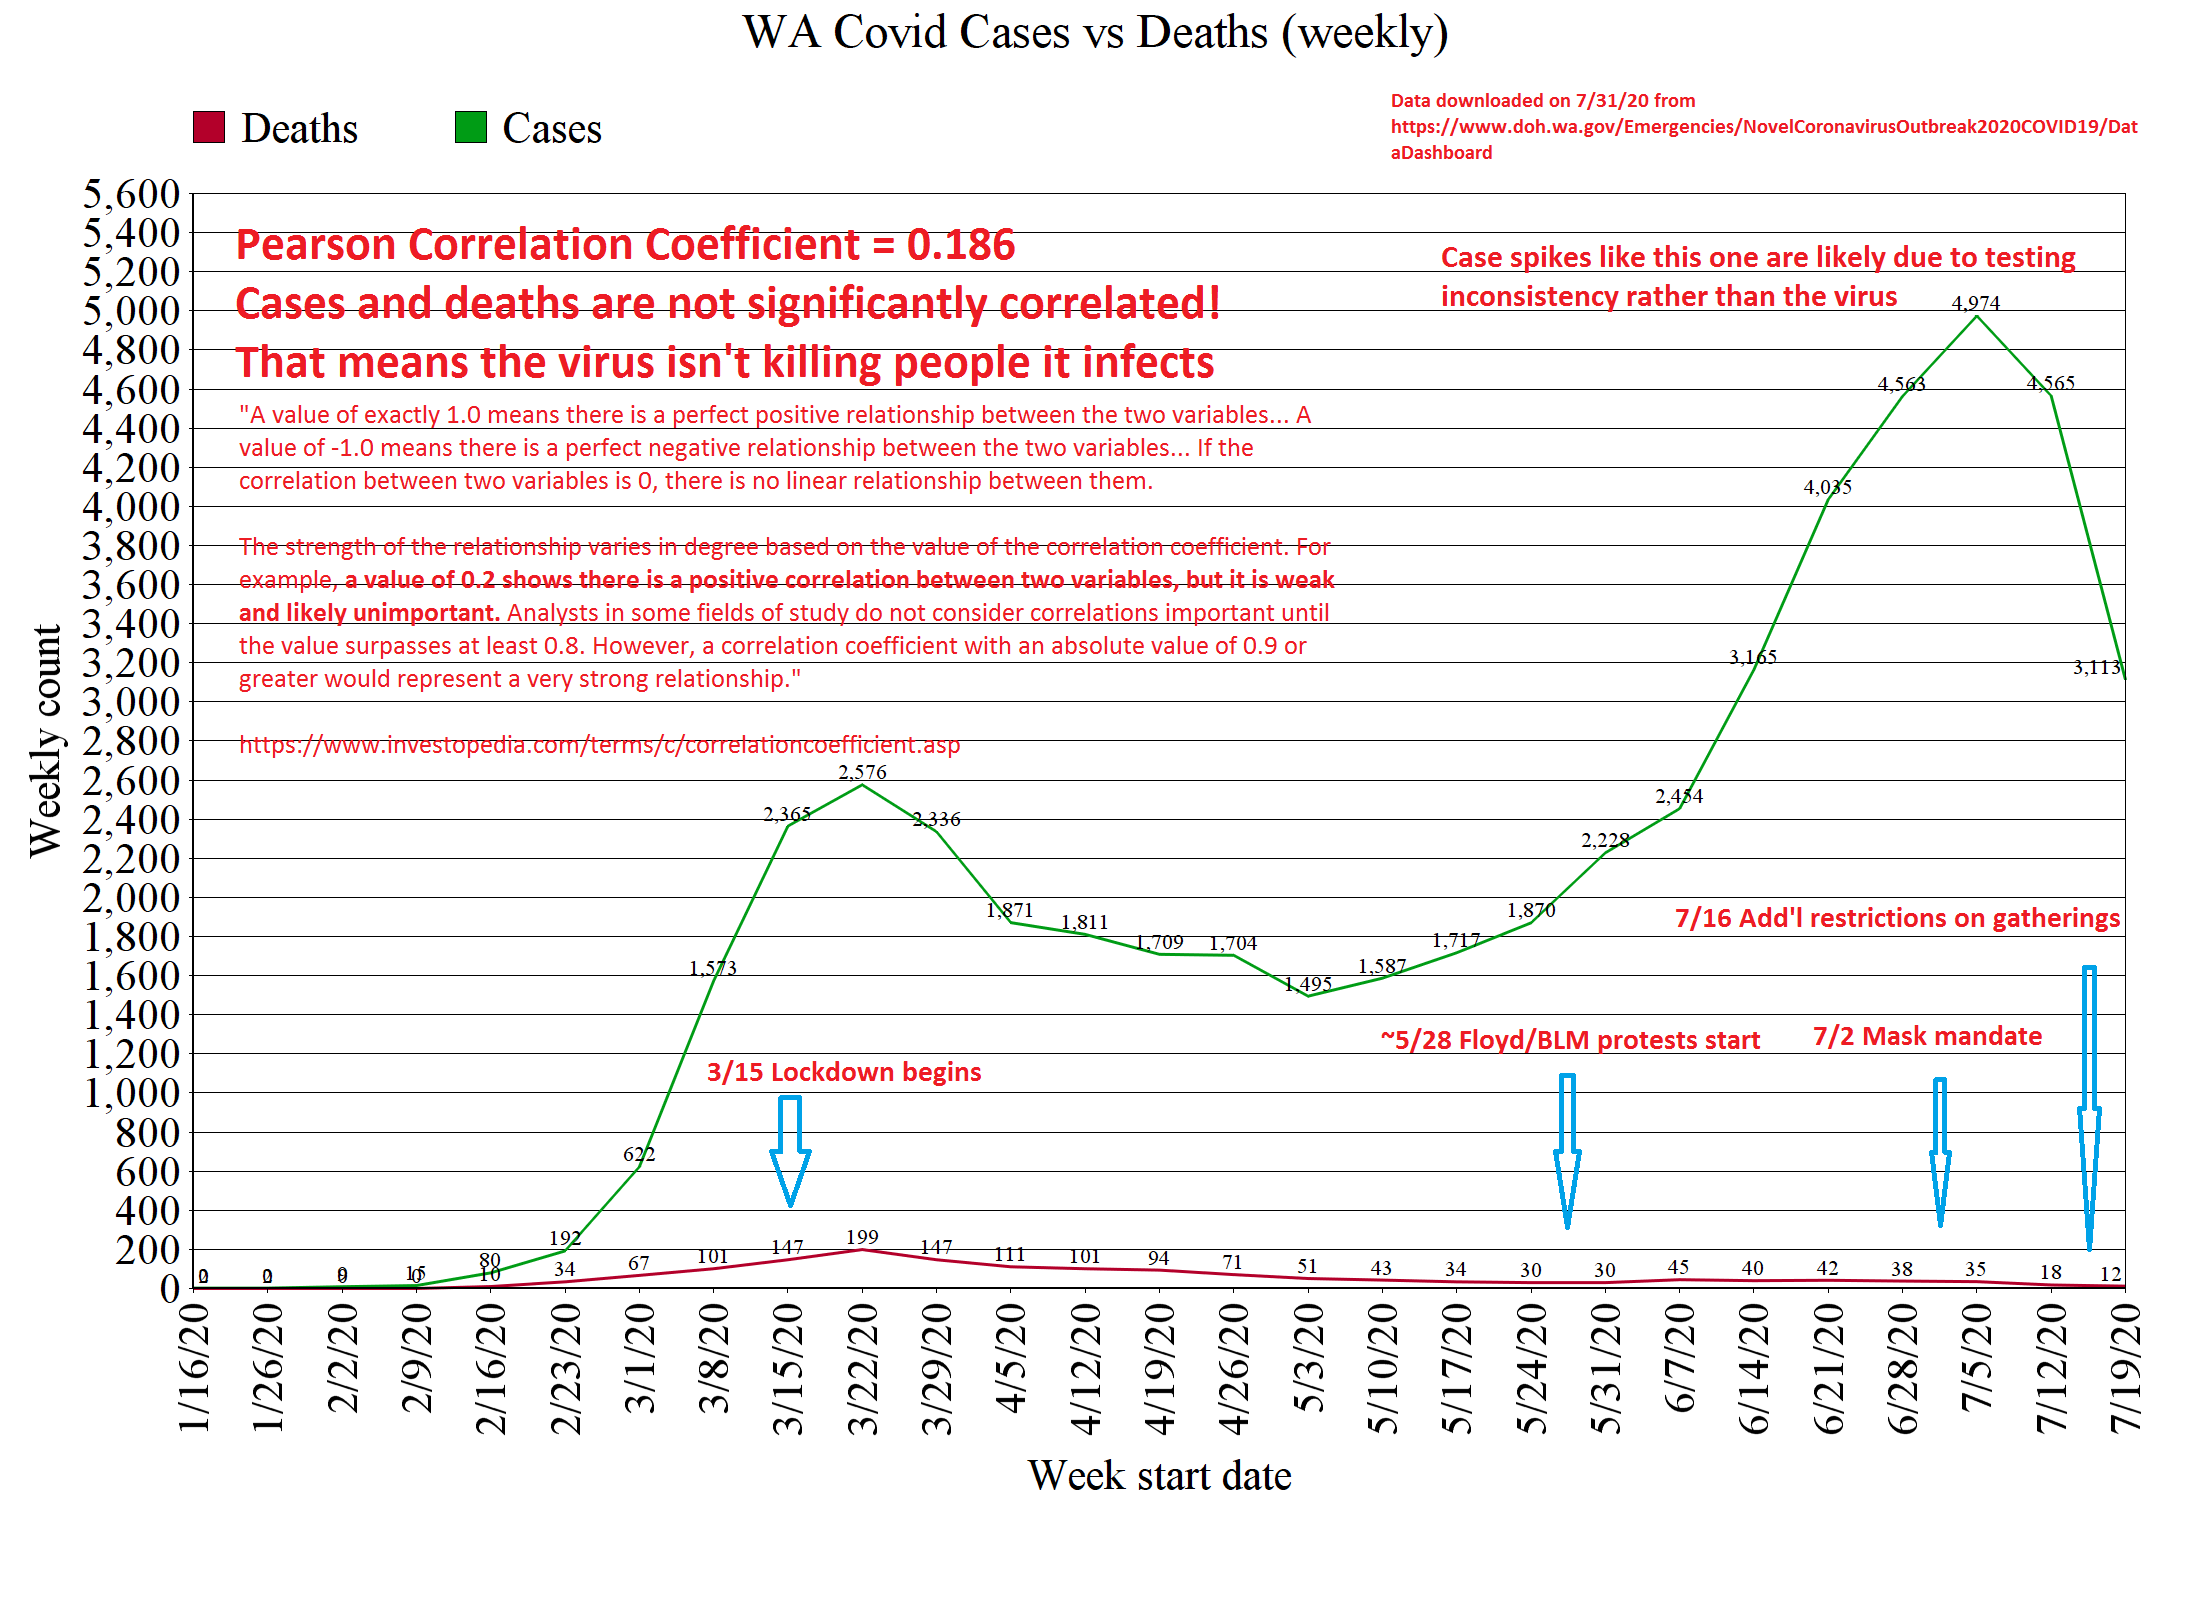
The graph of weekly death counts clearly shows that after the initial “pandemic” in March, the June/July increase in cases was not accompanied by a spike in deaths. The correlation coefficient for the graph shows there is no significant linear correlation between cases and deaths for the period from mid Jan to late July. An increase in cases is no longer leading to an increase in deaths, claiming otherwise is false. This likely means that the increase in cases is due to factors other than the virus itself, such as an increase in testing.
It’s not clear just from looking at these graphs whether or not the lockdown had any effect at all on the number of cases or deaths back in March when it was instituted. The numbers do dip the week after the lockdown takes effect but the death counts were hardly spiking to begin with. There is no way of knowing if that was because of the lockdown or not because we have no identical control group.
Demographics
As of 7/31, 89% of the deaths in WA have been people over 60. ZERO PERCENT have been under 20.
Furthermore it is known that older people with pre-existing conditions are most vulnerable to this virus. In this study, 78% of patients who needed ICU admission had at least one serious risk factor such as diabetes, chronic lung disease, and cardiovascular disease:
“…risk factors for severe disease include older age and the presence of at least one of several underlying health conditions… The percentage of COVID-19 patients with at least one underlying health condition or risk factor was higher among those requiring intensive care unit (ICU) admission (358 of 457, 78%) and those requiring hospitalization without ICU admission (732 of 1,037, 71%) than that among those who were not hospitalized (1,388 of 5,143, 27%). The most commonly reported conditions were diabetes mellitus, chronic lung disease, and cardiovascular disease.”
https://www.cdc.gov/mmwr/volumes/69/wr/mm6913e2.htm
Comparing C19 to Other Causes of Death
How does C19 compare to the usual deadly suspects in WA State? The following is a tabulation of published DOH data for deaths from 2016-2018 (the most recent years available) side by side with C19 deaths in 2020. The average 12-month death toll for C19 of 2,681 uses a raw average, which simulates the case where the virus suddenly becomes as deadly as it was in the spring again in the fall.
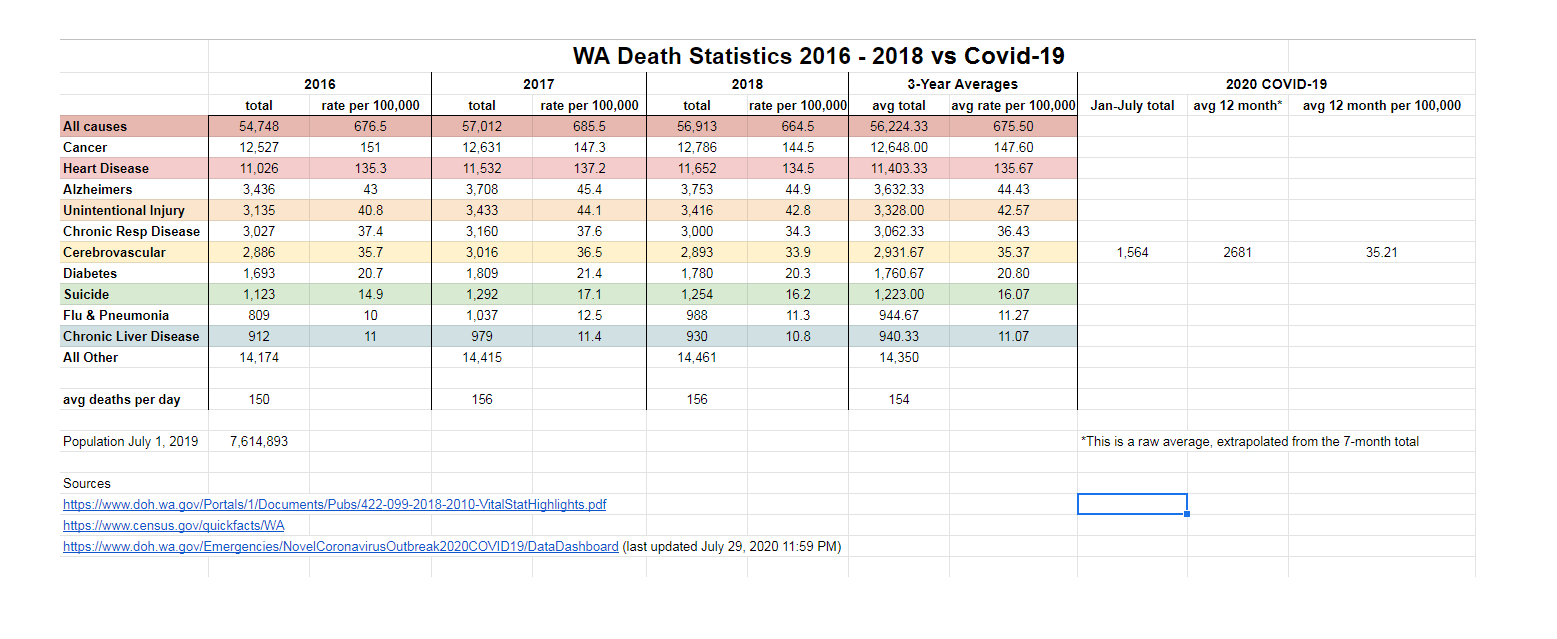
On an average year, cerebrovascular disease (stroke, etc), chronic respiratory diseases, unintentional injury (accidents), alzheimers, heart disease, and cancer all kill more people than Covid is on track to this year (and that’s being generous to Covid). Heart disease kills almost 4x as many ppl and cancer kills almost 5x as many as the great and terrible coronavirus, but the authorities are not declaring a state of emergency to deal with them.
No one is acting as though there is a great cancer or heart disease pandemic which requires urgent action and a complete cessation of all civil liberties to remove risk factors and overhaul society. Banning smoking, sugar, and air/water pollution to lower cancer & chronic disease risk would save more way lives than curing the virus. As would mandating daily sunshine & exercise.
Yet there is no media blitz accompanied by top-down mandates to remake our lives and lower our exposure to carcinogens and there never will be. There is no talk of a “new normal” to combat the terrible threat of alzheimers, cancer, or heart disease.
The Eye Test
This is anecdotal but it bears mentioning. I have never once seen a person who looked or acted sick since the “pandemic” began. I don’t know anyone who knows anyone who has gotten sick, let alone died. Nor have I seen any dead bodies in the street. Have you? It’s almost as though if nobody watched the news, there would be no virus at all.
Again, this is completely anecdotal, but one would think that for any threat so severe as to warrant intentionally causing severe damage to our economy and indefinitely suspending freedom of assembly, freedom of worship, and in many cases the freedom to open your business and feed your family, there would be some plainly available evidence for all to see. Every one of us would have friends or family who had become seriously ill or died. We’d all be seeing the horrific devastation being wreaked by the worst virus to ever exist. A virus which has in 5 months killed .0194% of the state’s population. At this rate, just 2,138.9 short years from now we’ll all be dead from the virus of doom.
Summary
This virus, like all other pathogens that have ever existed, is most deadly to the weak and vulnerable. In this case, that is almost exclusively the elderly with pre-existing conditions. There is currently no significant correlation between number of cases and number of deaths in WA. The virus has so far resulted in fewer total deaths than the normal 6 leading causes of death in this state and the viral death rate is falling by the week.
Based on this data, the lockdown in this state should’ve ended in early or mid April. Instead we’ve had ever-increasing mandates, restrictions, and indefinite suspension of liberties based on fear from their ridiculous “total cases” accounting method which obscures the fact that almost nobody is dying.
That’s right, almost no one is dying. There is no existential threat. Deaths per week have been steadily decreasing for 16 weeks and the week of 7/19 there were only 12! In a state with 7.7 million people! I could end this analysis right here but I’m really just getting started.